Nowadays map based online applications live their high popularity. This pheomenon can be explained with several reasons. First of all, we live in an information society in the age of information when information is generated in an enormous quantity by the users of the internet and internet capable devices. Part of this huge quantity of data has spatial information, the exact location where it was created. These data can be processed in several ways from data mining to statistics, but for us the most important feature is that they can be represented geographically on maps.
The second reason of the high popularity of online maps is the characteristic of the web itself, and the continuous improvement of browsers and different web technologies. Web applications are always online, always reachable for anybody and mainly from any device, and can deliver information to a very broad scale of people very fast. Beside the universality of the web, the improvements of browsers and underlying technologies in the last years has made it possible to develop fast, user friendly and feature rich online applications which allow us to visualize data and create and edit them online.
And finally the tools for working with geographical information has reached the level where nearly anybody can easily make web based online applications with little or even no knowledge of geography, cartography, or programming. These tools hide all the scientific details behind useful APIs, with which programmers only need to concentrate on the desired functions, not the mathematical calculations. There are several tools on the market, from which we will introduce the Google Maps API and the OpenLayers API.
There are different denominations in the literature related to online mapping.
Before we dive into the details of these APIs, we should speak a few words about online map applications in general. What makes an application a web-mapping application? To put it simple, it is some type of online application which utilizes a map for the desired functions. The core of these kind of applications is the map and they do something with this map:
Different types of online map applications can be distinguished according to different aspects of aims using online maps:
The map itself consists of three different kind of entities:
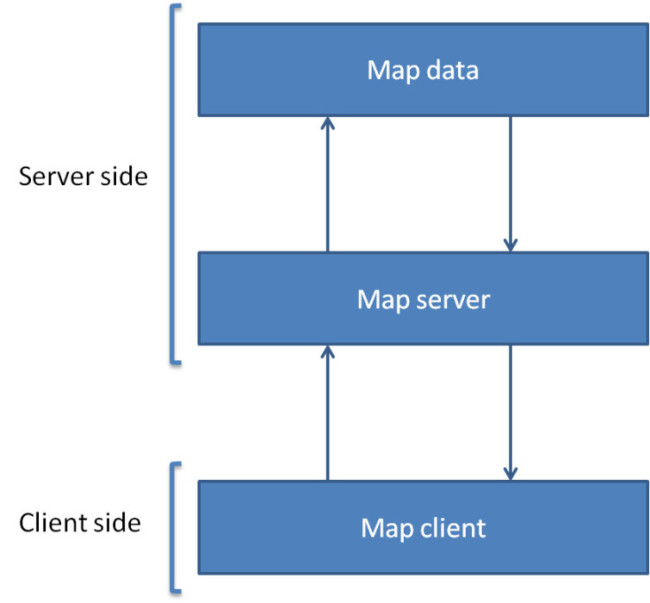 The architecture of online maps
This curriculum deals only with the client side of these web mapping applications. Our main goal is to demonstrate the capabilities of these client libraries, to give idea about their usage, and to show how easily can program them. In this manner the curriculum is rather technical, and does not deal with map data creation and map server configuration.
Visualizing:
Platform:
Map data and service providers:
On the client side of web mapping applications it is not the programmer’s task to write all the program code to handle map-related processes, but usually specific libraries are used to simplify the task. These libraries supply all the basic, general and high-level functions and procedures with which programmer can concentrate on the business logic and not the details. A programmer usually wants to display a map, and does not care how to do that; wants to put markers, shapes onto the map, and does not want to bother with the technical details.
These pre-written libraries are provided by others, and we use their high-level programming interface during application development. These libraries are called APIs, Application Programming Interfaces.
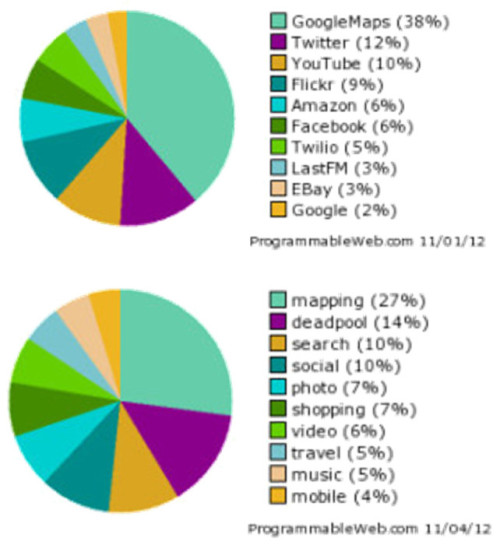 Distribution of different kind of APIs
If our application uses at least one external data or program source, than it can be considered as mashup: an application which integrates several independent services. Our web mapping applications are generally mashups, because we use client side map APIs, and sometimes external mapping data, for example in the case of Google Maps, OpenStreetMap, and so on.
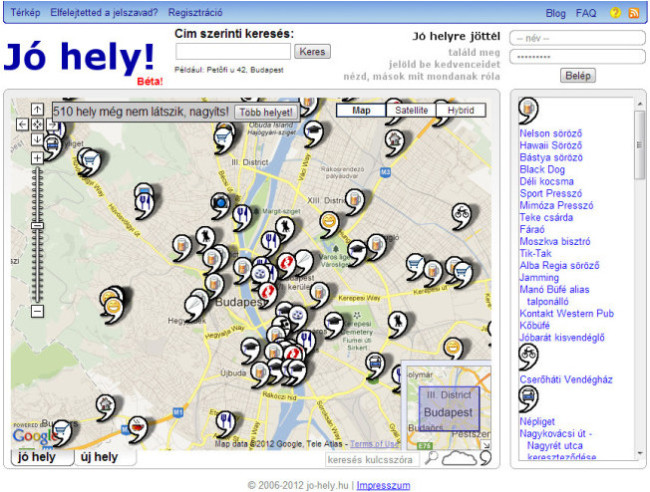 An example for mashup using online map
There are several terms and technological issues which is worth to know about client side maps.
In order to place objects onto the map we have to assign a coordinate to that object, e.g. it is need to be geocoded. There are different coordinate systems in GIS applications, which have different format to describe the coordinate. There are software libraries which help transforming from one format to another.
On a map a three dimensional object is represented in two dimensions. The method of representing the Earth’s surface on a two dimensional plane is called projection. There are several possible methods to this projection. Because we lose one dimension during projection, every projection has some distortion. There are different projections according to the characteristic they represent. For example there are projections that preserve area, scale, shape, distance, or direction, etc. There is no perfect projection; we have to choose the right one according to the specific need of the application.
The most popular map services, such as Google Maps, Yahoo, OpenStreetMap, Bing, use the so-called Mercator projection, which projects the Earth’s surface onto a cylinder. From the nature of this projection there are large distortions near the poles.
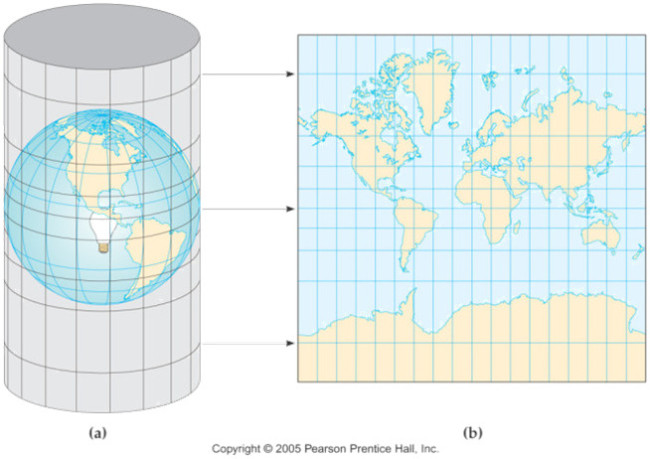 The Mercator projection
Projections are identified by codes which depend on the classification system describing them. For example OpenLayers uses EPSG codes. In this the Mercator projection is EPSG 900913, and OpenLayers uses EPSG 4326 by default.
Map libraries usually display the world map as a raster image. There different images according to the magnifications. On higher zoom level these huge images are divided into smaller tiles, and only those are loaded from the server which are in, or very close to the display area. Every tile is identified by its coordinates, so the map library knows where to place it on the map. If we pan the map, than the client send a request to the server to load the required images.
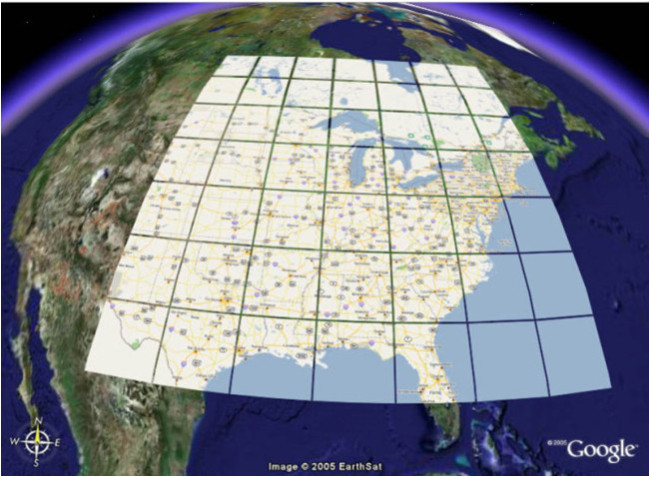 Dividing raster images to several tiles according to the magnification
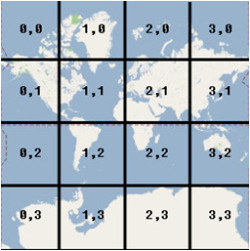 Tiles on Google Maps
Different types of object can be placed onto a map beside map images:
Map libraries may have other services beside displaying the map:
  |
 |
 |
Generated with ELTESCORM framework