If need high customization in our application, then we need a map API, which usually provides a flexible interface for creating GIS map applications by programming. There are several general-purpose web mapping API:
In the following the OpenLayers API will be introduced to represent how easily a web mapping application can be made with a little programming knowledge.
In this chapter we introduce another great tool for creating web-mapping applications, the OpenLayers API, which gives mapping features in a very programmer-friendly way.
OpenLayers is an open source, client side JavaScript library for making interactive web maps, viewable in nearly any web browser including mobile web browsers. As a client side library no server side script or configuration needed, it can work with several different types of map servers seamlessly as we will see later in the chapter. As a library on the one hand it gives all the tools to display maps and data easily and fast, but on the other hand opens the door to control the fine details of the processes.
OpenLayers differs from Google Maps, Bing Maps, Yahoo! Maps, etc in more ways. First of all it does not work with one kind of data or map server, but as a mapping framework gives a chance to choose from them. Google Maps API is tied to the Google Maps server, to the Google Maps images. In the case of Bing Maps and Yahoo! Maps this is the same. Contrarily, OpenLayers can combine maps from different sources. Secondly, in the case of Google Maps, and any third party services, we are not in control of the backend, and there may be some commercial restrictions. With OpenLayers we have the chance to customize the server side (we won’t do that in this curriculum), and due to the open source code we do not depend on third party companies, and we are able to see the code during debugging. We can style OpenLayers much more than we can Google Maps, and finally we can change the map projection with a suitable server to make high precision geographical operations.
The main difference in OpenLayers API compared to Google Maps API is the layer philosophy. In OpenLayers a map can contain several layer on top of each other, each layer has its own type of data from even different map server. Each layer is above and will cover up the previous one; the order that you add in the layers is important. With OpenLayers, you can arbitrarily set the overall transparency of any layer, so you are easily able to control how much layers cover each other up, and dynamically change the layer order at any time. For example the first layer can contain Google maps, the next one can be an image layer containing weather information, and the third one can be a vector layer with different markers on it.
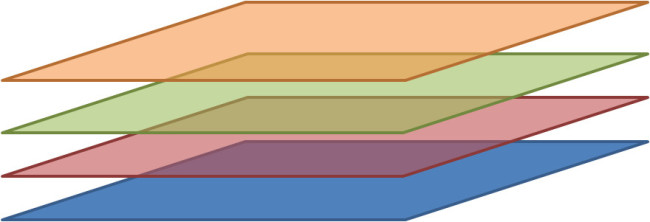 Layers in OpenLayers
The OpenLayers bundle can be downloaded from the official OpenLayers website. At the time of writing the version number of the latest stable release is 2.12. The compressed file contains a lot of files and folders, but we only need the OpenLayers.js file and the img and theme folder. To start, copy these files and folders into a new empty folder, and create a file for the HTML template (e.g. index.html ):
<!DOCTYPE html>
<html lang="en">
    <head>
        <meta charset="utf-8" />
        <title>My OpenLayers Map</title>
        <link type="text/css" rel="stylesheet" href="map.css" />
        <script type="text/javascript" src="OpenLayers.js"></script>
        <script type="text/javascript">
var  map;
function init() {
//The code goes here
}
        </script>
    </head>
    <body onload="init();">
        <div id="map">
    </div>
    </body>
</html>
This is a very basic HTML5 document. In the body we set out the place for the map with the <div> element. The map will be displayed in this element in the same size. In the <head> section we load the corresponding stylesheet (map.css ), the OpenLayers JavaScript library (OpenLayers.js ), and in the last <script> block we prepare a map variable for the map object, and the init() function will be called when the page loaded. (Of course this script block should be put to a separate JavaScript file, but for the sake of simplicity, the script code goes into the HTML file.)
The map.css file contains the minimal style informations. These settings make the map fill out the whole browser window.
html, body {
    margin: 0;
    padding: 0;
    width: 100%;
    height: 100%;
}
#map {
    width: 100%;
    height: 100%;
}
Finally it is recommended to install a JavaScript console, where the map and its attributes can be explored. Nowadays every major browser has its own JavaScript console, in Mozilla Firefox the Firebug plugin is advisable to use.
This curriculum is not an API reference. In the following a lot of OpenLayers class and object will be introduced. We suggest everybody to consult with the official API documentation on demand for detailed description.
In OpenLayers on the top of the hierarchy stands the map object itself. The map object is an instance of the OpenLayers.Map class, and generally can be created by the following code:
map = new OpenLayers.Map(map_element, options);
Here map_element is the corresponding HTML element, tipically a<div> , in which the map will be displayed, the options is a JavaScript object with key-value pairs. We need to determine at least the first parameter. Hence the following code creates a map in the div element with ‘map’ id:
map = new OpenLayers.Map('map');
Some of the options will be described later in this chapter.
The map consists of layers, so the next task is to add at least one layer to the map. There are different kind of layers according to type of the backend server and the map data. All of them are the subclasses of the OpenLayers.Layer class. For example Google maps can be displayed with the help of the OpenLayers.Layer.Google class. Each of these layer subclasses has its own parameters according to the specific map data. Generally they can be instantiated with the following code:
var layer = new OpenLayers.Layer.TYPE(parameters);
After creating the layers, they can be added to the map one by one:
map.addLayer(layer1);
map.addLayer(layer2);
or altogether as an array of layers:
map.addLayers([layer1,layer2,...]);
In OpenLayers there are two types of layers. The first one is the base layer. This is always shown. There could be more than one base layer added to the map, but only one can be selected. The other type of layer is the overlay layer. There could be several overlay layer, and their visibility can be set independently. The layer type can be set through the layer options object with the isBaseLayer property set to true or false, or the setIsBaseLayer() function of the layer (e.g. layer.setIsBaseLayer(true) ).
This is the basic knowledge for creating a map, now let us look at the different types of raster layers in the following.
In OpenLayers Google Maps can be a base layer with the help of the OpenLayers.Layer.Google class. The general form of instantiation is the following:
var google_layer = new OpenLayers.Layer.Google(layer_title, layer_options);
Both of the parameters are optional, the layer_title is mainly for human readability, it represents the layer on certain controls such as the layer switcher control; the layer_options are specific options influencing the behavior of the map (see the API reference). For displaying Google Maps in OpenLayers the minimum amount of code can be seen below (inside the init() function):
var map = new OpenLayers.Map('map_element');
var google_streets = new OpenLayers.Layer.Google();
map.addLayer(google_streets);
map.setCenter(new OpenLayers.LonLat(2140236.7916869, 5918060.4771277), 7);
First of all we create the map, secondly a new Google layer is generated with no parameters. Then we add the layer to the map. The fourth line is not necessary; it centers the map above Hungary and set the zoom level to a proper size. The center is given in longitude and latitude coordinates in the spherical Mercator projection which is used by Google maps. It measures the distance in meters from the center of the coordinate system.
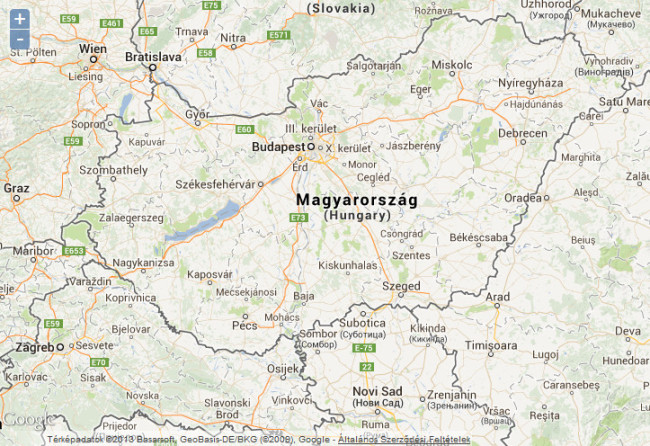 Google Maps data in OpenLayers showing roadmap
Google offers different type of maps to display. Of course it is possible to switch between these map types. To achieve this we have to create separate layers for each map type, and then add them to the map. Each layer will be a base layer. We have to add a special control, the so called layer switcher control allowing us to switch between the layers on the map. The map type can be determined in the options object of the Google layer with the type option.
map = new OpenLayers.Map('map', {
    projection: 'EPSG:900913',
    units: 'm',
    maxResolution: 2000
});
var google_hybrid = new OpenLayers.Layer.Google(
    "Google Hybrid",
    {type: google.maps.MapTypeId.HYBRID}
);
var google_physical = new OpenLayers.Layer.Google(
    "Google Physical",
    {type: google.maps.MapTypeId.TERRAIN}
);
var google_satellite = new OpenLayers.Layer.Google(
    "Google Satellite",
    {type: google.maps.MapTypeId.SATELLITE}
);
var google_streets = new OpenLayers.Layer.Google(
    "Google Streets",
    {type: google.maps.MapTypeId.ROADMAP}
);
map.addLayers([google_hybrid,google_physical,google_satellite,google_streets]);
map.addControl(new OpenLayers.Control.LayerSwitcher());
map.setCenter(new OpenLayers.LonLat(2140236.7916869, 5918060.4771277), 7);
Beside the map element some other options were set in the map constructor. This example shows that there can be multiple base layers, but only one can be activated at a time.
 Multiple type of Google Maps in OpenLayers
Microsoft’s map is available through the OpenLayers.Layer.Bing class. This constructor has only one parameter, the options object which has several layer-specific option. For example the title can be set with the name option, the map type depends on the type option. For using the map an API key is needed, which can be required on the Bing Maps portal. The minimum requirements for a Bing map can be seen below:
map = new OpenLayers.Map('map');
var bingApiKey = "api_key";
var bing = new OpenLayers.Layer.Bing({key: bingApiKey});
map.addLayer(bing);
map.setCenter(new OpenLayers.LonLat(2140236.7916869, 5918060.4771277), 7);
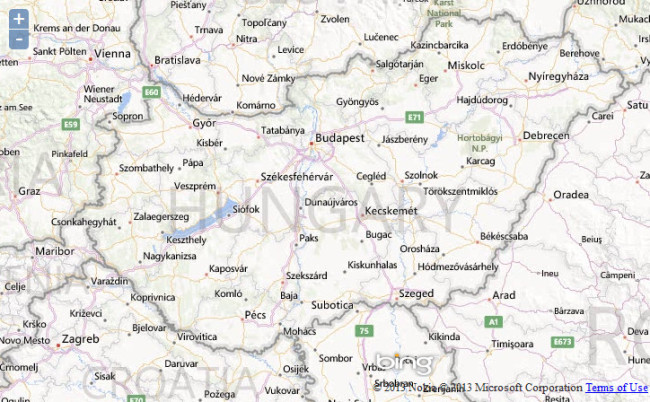 Bing Map in OpenLayers
Bing also has different types of map. The following code shows how to create a map with all possible map types with a layer switcher control.
map = new OpenLayers.Map('map');
var bingApiKey = "api_key";
var road = new OpenLayers.Layer.Bing({
    name: "Road",
    type: "Road",
    key: bingApiKey
});
var hybrid = new OpenLayers.Layer.Bing({
    name: "Hybrid",
    type: "AerialWithLabels",
    key: bingApiKey
});
var aerial = new OpenLayers.Layer.Bing({
    name: "Aerial",
    type: "Aerial",
    key: bingApiKey
});
map.addLayers([road, hybrid, aerial]);
map.addControl(new OpenLayers.Control.LayerSwitcher());
map.setCenter(new OpenLayers.LonLat(2140236.7916869, 5918060.4771277), 7);
 Multiple type of Bing Maps in OpenLayers
Yahoo! has announced that its map service would be closed, but at the time of this writing the service is available. OpenLayers offers access for the Yahoo! map as well by the OpenLayers.Layer.Yahoo class. The constructor has two parameters, the layer title and the layer options object. To display a minimal Yahoo! map is as easy as the following four lines of code:
map = new OpenLayers.Map('map_element');
var yahoo = new OpenLayers.Layer.Yahoo();
map.addLayer(yahoo);
map.setCenter(new OpenLayers.LonLat(19.072265625, 47.309034247748), 7);
The only difference contrary to the maps before that Yahoo uses another projection (EPSG:4326), so the longitude and latitude coordinates are in degrees, which could be familiar from the GPS coordinates.
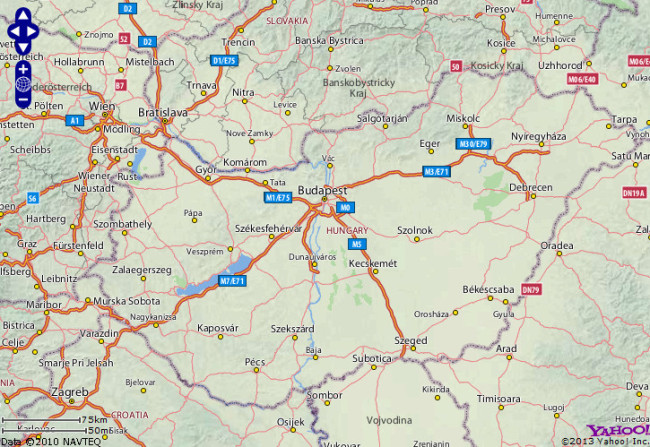 Yahoo Maps in OpenLayers
Creating a multi layer Yahoo! map is similar to the others. The type option is responsible for the map type, without it the default map type, the street-like map will be shown.
map = new OpenLayers.Map('map');
var yahoo_hybrid = new OpenLayers.Layer.Yahoo(
    "Hybrid",
    {type: YAHOO_MAP_HYB}
);
var yahoo_satellite = new OpenLayers.Layer.Yahoo(
    "Satellite",
    {type: YAHOO_MAP_SAT}
);
var yahoo_street = new OpenLayers.Layer.Yahoo(
    "Street",

);
map.addLayers([yahoo_hybrid, yahoo_satellite, yahoo_street]);
map.addControl(new OpenLayers.Control.LayerSwitcher());
map.setCenter(new OpenLayers.LonLat(19.072265625, 47.309034247748), 7);
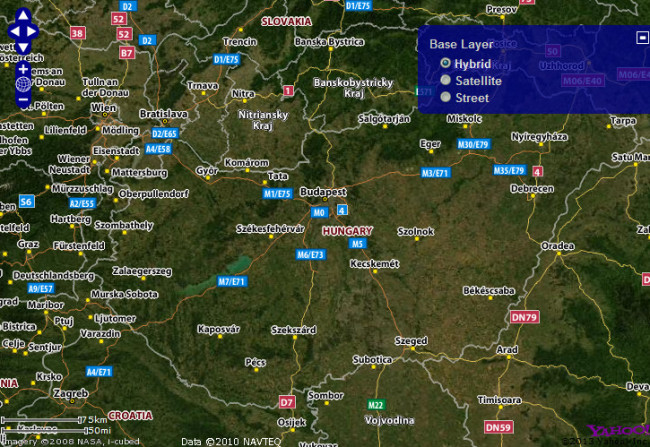 Multiple type of Yahoo Maps in OpenLayers
OpenStreetMap is a free, wiki-style map of the world driven by user contributed content. Unlike the previous APIs, OpenStreetMap does not have different map types, only a street-like map is accessible.
Setting up an OpenStreetMap map in OpenLayers is very simple. The constructor of the OpenLayers.Layer.OSM class has three optional parameters: the layer title, a layer url, and the layer options object. A minimal OpenStreetMap map can be achieved by the following code:
map = new OpenLayers.Map('map');
var osm_layer = new OpenLayers.Layer.OSM();
map.addLayer(osm_layer);
map.setCenter(new OpenLayers.LonLat(2140236.7916869, 5918060.4771277), 7);
In a typical scenario at least the layer title is set for user friendly purpose.
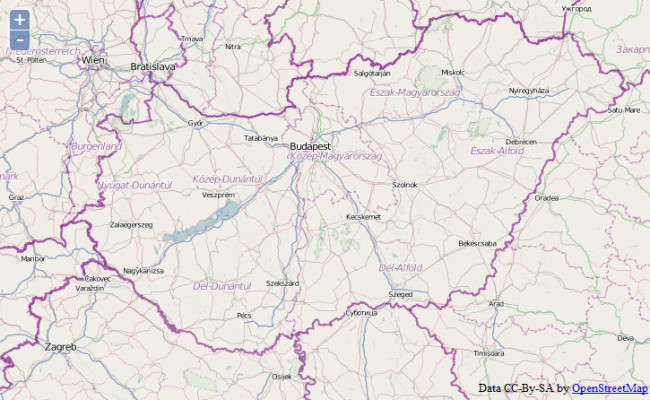 OpenStreetMap in OpenLayers
With OpenStreetMap layer it is possible to use our own tiles of images. All we have to do (after preparing the map data and the map server) is assigning the proper url-array to the second parameter:
    var layer = new OpenLayers.Layer.OSM("OpenCycleMap",
      ["http://a.tile.opencyclemap.org/cycle/${z}/${x}/${y}.png",
       "http://b.tile.opencyclemap.org/cycle/${z}/${x}/${y}.png",
       "http://c.tile.opencyclemap.org/cycle/${z}/${x}/${y}.png"]);
Web Map Service (WMS) is an international standard developed by the Open Geospatial Consortium (OGC). WMS is implemented by many geospatial servers, for example the free and open source GeoServer and MapServer. WMS is just another protocol to serve map data through a map server to the client. WMS is typically used for displaying user created, unique data. With WMS we can publish our own map data with ease to be reachable for everyone in the world.
There are many open WMS servers which can be used to display data. We will use the map data from OSGeo servers ( http://vmap0.tiles.osgeo.org/wms/vmap0 ), but further services can be found on the internet or on this site. To find out what kind of data or layers a WMS server can be served, we have to put the?request=GetCapabilities&service=WMS&version=1.1.1 . query string after the url of the WMS server. In the response we get an XML file describing the capabilities of the service.
WMS data consists of different layers on the server side. In a request the client can determine which layers would like to get in response, but these layers will be shown in one layer on the client side.
The OpenLayers.Layer.WMS constructor has four parameters: the title of the layer, the url of the WMS server, an object with key-value pairs representing the query string parameters and parameter values, and the object of the client side layer options.
var wms = new OpenLayers.Layer.WMS(
    layer_title,
    url,
    server_options,
    client_options
);
For a minimal WMS map we only have to specify these parameters as it can be seen in the following code:
map = new OpenLayers.Map('map');
var wms = new OpenLayers.Layer.WMS(
    'Basic WMS layer',
    'http://vmap0.tiles.osgeo.org/wms/vmap0',
    {
        layers: 'basic'
    }
);
map.addLayer(wms);
map.setCenter(new OpenLayers.LonLat(19.072265625, 47.309034247748), 7);
Here we ask the OSGeo server to give the data belonging to the basic layer on the server.
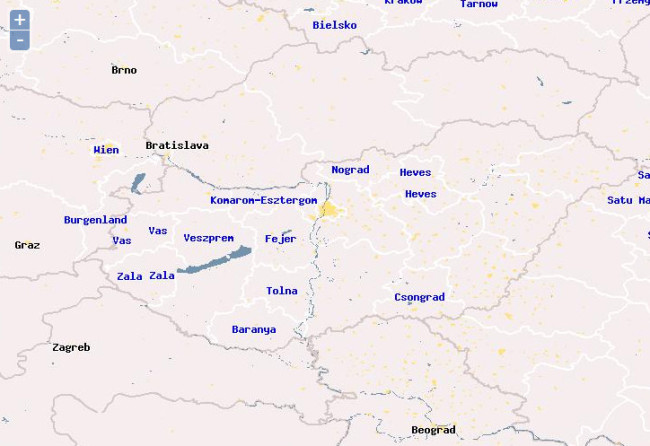 WMS in OpenLayers
In the following example we will have two layers. The first one will be the base layer in which three server side layers will be displayed: the basic world map, the population data, and the state boundaries. The second client side layer will be an overlay layer, and this contains the three different kinds of labels. The overlay layer can be switched on or off with the help of a layer switcher control. The second layer has a server side option which controls the transparency. This is necessary because without it the overlay layer would cover the base layer. The client opacity option makes the overlay layer transparent in 50%, so the base layer shows through the second layer.
map = new OpenLayers.Map('map');
var wms_basic = new OpenLayers.Layer.WMS(
    'Basic WMS layer',
    'http://vmap0.tiles.osgeo.org/wms/vmap0',
    {
        layers: 'basic,population,stateboundary'
    },
    {
        isBaseLayer: true
    }
);
var wms_labels = new OpenLayers.Layer.WMS(
    'Labels',
    'http://vmap0.tiles.osgeo.org/wms/vmap0',
    {
        layers: 'clabel,ctylabel,statelabel',
        transparent: true    //empty spaces are transparents
    },
    {
        isBaseLayer: false,
        opacity: 0.5
    }
);
map.addLayers([wms_basic,wms_labels]);
map.addControl(new OpenLayers.Control.LayerSwitcher());
map.setCenter(new OpenLayers.LonLat(19.072265625, 47.309034247748), 7);
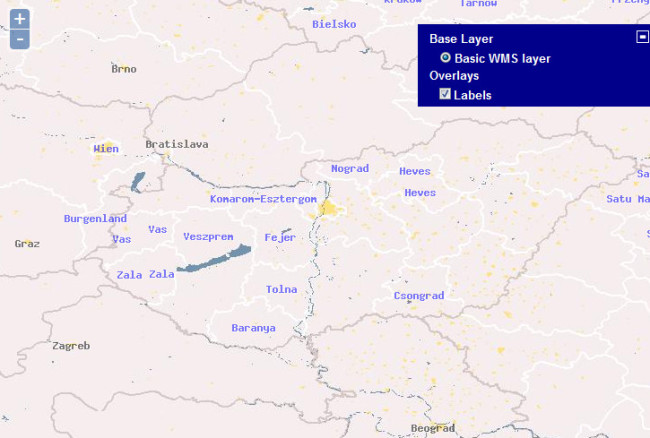 Multiple layers of WMS in OpenLayers
There are further developments in the WMS standard. For example WMTS is another OGC standard for serving tiled images. This protocol is used for example by the NASA map services, and can be used through the OpenLayers.Layer.WMTS class.
There are several options for the map and layer objects. Here we list some options which are good to know if we plan a mapping application.
The raster layers, some of them is mentioned so far in this lesson, are passive in the sense that they only display the corresponding images. We can move the map, zoom it, pan it, but there is nothing more in the background than showing the right images according to the location and zoom level. But what if we would like to mark a place which is interesting for us in some respects, or we need to measure the distance between two points, calculate the area of selected territory, show further information about a place, a house, a lake, and so on which is on the map in a form of an image?
In OpenLayers the Vector layer is generally used to solve these tasks: to display data on top of a map and allow real time interaction with the data. The vector layer basically display geometrical shapes: circles, lines, polygons. But there are further information belonging to these shapes: data description and styling information. These three kind of information, the geometry, the data and the style, are integrated into the basic unit of the vector layer, the so called feature. So in summary the vector layer contains features, which are styled geometrical shapes with additional information.
The vector layer and the features basically live on the client side. They have to be loaded once, and no further server requests are needed to work with them (Web Feature Service, WFS, is an exception, but this lesson will not cover this). The limitation of the vector layer also comes from the nature of the client side. Because we have to store and process them in the client’s browser, the client’s computer determines the processing capacity. It mainly depends on the memory and the processor of the computer. There is no hard number in the amount of features, but over a couple of hundreds of feature will start to slow down things.
The very basic task in working with vector layers is display a point on a map. To achieve this, we have to create a vector layer and a feature, add the feature to the vector layer, and add the vector layer to the map. Let us take a look at this process in general, and then by an example.
The vector layer is an instance of the OpenLayers.Layer.Vector class with the already known title and options parameters.
var vector_layer = new OpenLayers.Layer.Vector(title, options);
The feature is generated by the OpenLayers.Feature.Vector() constructor which has the aforementioned three parameters: the geometry, the data attributes, and the styling information.
var feature = new OpenLayers.Feature.Vector(geometry, attributes, style);
The geometry is an instance of the OpenLayers.Geometry.TYPE class, where type can be Point , LineString , or Polygon . Each of these constructors has their own kind of parameters (see the API reference for detailed instructions and the examples below).
var pointGeometry = new OpenLayers.Geometry.Point(x, y);
var lineGeometry = new OpenLayers.Geometry.LineString([point1, point2, ...]);
var linearRingGeometry = new OpenLayers.Geometry.LinearRing([point1, point2, ...]);
var polygonGeometry = new OpenLayers.Geometry.Polygon([linearRingGeometry]);
It is very important that the projection of the map and the data on a vector layer may be different. The projection of the vector layer must be the same as the projection of the map, and the location data must be transformed into the right projection. Internal operations make this transformation automatically, but during manual processing the transform() method of the OpenLayers.Geometry class can be very handy.
The following example shows how to display a point on a WMS map.
map = new OpenLayers.Map('map');
var wms = new OpenLayers.Layer.WMS(
    'Basic WMS layer',
    'http://vmap0.tiles.osgeo.org/wms/vmap0',
    {
        layers: 'basic,population,stateboundary,clabel,ctylabel,statelabel'
    }
);
map.addLayer(wms);
var vector_layer = new OpenLayers.Layer.Vector('Vector Layer', {
    projection: 'EPSG:4326'
});
var pointGeometry = new OpenLayers.Geometry.Point(
    19.06248,
    47.47231
);
var pointFeature = new OpenLayers.Feature.Vector(
    pointGeometry
);
vector_layer.addFeatures([pointFeature]);
map.addLayer(vector_layer);
map.addControl(new OpenLayers.Control.LayerSwitcher());
map.setCenter(new OpenLayers.LonLat(19.072265625, 47.309034247748), 7);
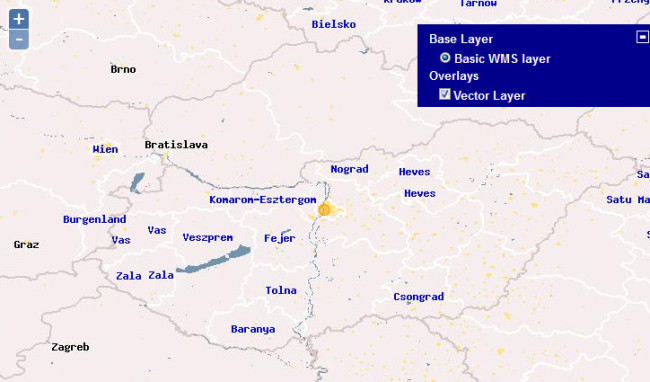 Point feature on a map in OpenLayers
This WMS layer was in the EPSG:4326 projection. On a map with different projection, the same goes, but the coordinates have to be in the proper units. This is the case for example in OpenStreetMap maps (EPSG:900913). Only the difference is shown in the following code:
//...
var osm_layer = new OpenLayers.Layer.OSM();
map.addLayer(osm_layer);
var vector_layer = new OpenLayers.Layer.Vector('Vector Layer', {
    projection: 'EPSG:900913'
});
var pointGeometry = new OpenLayers.Geometry.Point(
    2122025.66970,
    6019511.52291
);
//...
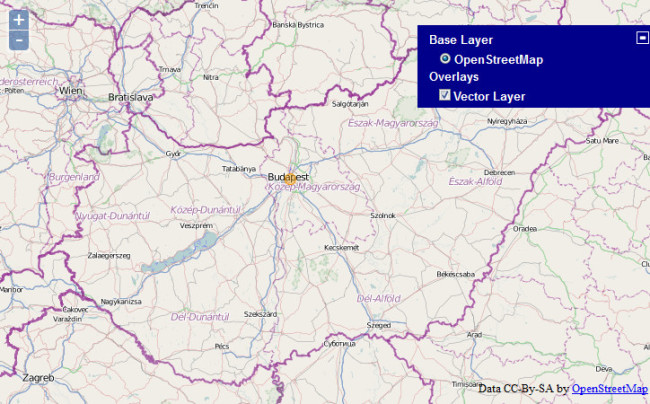 Point feature in different projection on a map in OpenLayers
If we have no influence on the data projection, then we have to transform the coordinates from the data projection to the map projection.
//...
var osm_layer = new OpenLayers.Layer.OSM();
map.addLayer(osm_layer);
var vector_layer = new OpenLayers.Layer.Vector('Vector Layer', {
    projection: 'EPSG:900913'
});
var pointGeometry = new OpenLayers.Geometry.Point(
    19.06248,
    47.47231
);
pointGeometry.transform(
    new OpenLayers.Projection('EPSG:4326'),
    new OpenLayers.Projection('EPSG:900913')
);
//...
In the following example we can see how to add features with different types of geometry: point, line, polygon.
map = new OpenLayers.Map('map');
var osm_layer = new OpenLayers.Layer.OSM();
map.addLayer(osm_layer);
var vector_layer = new OpenLayers.Layer.Vector('Vector Layer', {
    projection: 'EPSG:900913'
});
//Point
var pointGeometry = new OpenLayers.Geometry.Point(2122025.66970, 6019511.52291);
var pointFeature = new OpenLayers.Feature.Vector(pointGeometry);
//Line
var point1 = new OpenLayers.Geometry.Point(2118547.78, 6017065.12);
var point2 = new OpenLayers.Geometry.Point(2132222.78, 6087065.12);
var lineGeometry = new OpenLayers.Geometry.LineString([point1, point2]);
var lineFeature = new OpenLayers.Feature.Vector(lineGeometry);
//Polygon
var polyPoint1 = new OpenLayers.Geometry.Point(2218547.78, 6217065.12);
var polyPoint2 = new OpenLayers.Geometry.Point(2332222.78, 6017065.12);
var polyPoint3 = new OpenLayers.Geometry.Point(2432222.78, 6217065.12);
var polyPoint4 = new OpenLayers.Geometry.Point(2632222.78, 6517065.12);
var polyPoint5 = new OpenLayers.Geometry.Point(2632222.78, 6617065.12);
var linearRingGeometry = new OpenLayers.Geometry.LinearRing([polyPoint1, polyPoint2, polyPoint3, polyPoint4, polyPoint5]);
var polygonGeometry = new OpenLayers.Geometry.Polygon([linearRingGeometry]);
var polygonFeature = new OpenLayers.Feature.Vector(polygonGeometry);
vector_layer.addFeatures([pointFeature, lineFeature, polygonFeature]);
map.addLayer(vector_layer);
map.addControl(new OpenLayers.Control.LayerSwitcher());
map.setCenter(new OpenLayers.LonLat(2140236.7916869, 5918060.4771277), 8);
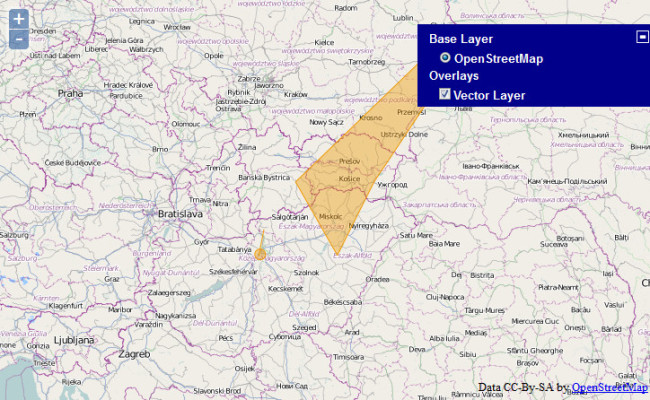 Point, line and polygon features on a map
To work with features they have to be on the map. There are two ways to put a feature on a vector layer: drawing manually and loading from a server.
Drawing features is very easy with the EditingToolbar control. With the help of this control we can draw points, lines and polygons on a vector layer. As the vector layer stores features on the client, reloading the map will clear the map. We have to ensure storing the features manually: either save them on the server, or export them to the client computer. The code below shows the usage of the EditingToolbar control. We have to simply add it to the vector layer:
map.addControl(new OpenLayers.Control.EditingToolbar(vector_layer));
The other way to populate the layer with features is loading them asynchronously from a server. The OpenLayers API allows different degree of abstraction of loading remote data. The most convenient way is to use the OpenLayers.Protocol.HTTP class. This class hides all the details of the asynchronous client-server roundtrip, providing the features ready to add to the layer. In this process the subclasses of then OpenLayers.Format class help, which support different types of standard formats for geospatial information, e.g. GeoJSON, GML, KML, mentioning the most widely used ones. Among the options of the vector layer the protocol option is responsible to make the whole loading process automatically by assigning an OpenLayers.Protocol instance to it. Using the protocol option in a vector layer we are forced to use at least one strategy which controls how the remote features are added to the layer. There can be several strategies at the same time, each of them must be an instance of one of the subclasses of the OpenLayers.Strategy class. The simplest one is the OpenLayers.Strategy.Fixed class which is put all the features onto the layer without any further operation.
In summary if we want to load feature data from a remote server, the most simplest way is to set the value of the layer’s protocol and its options, determine the data format, and set a Fixed strategy. The example below shows how to do it in practice while we load some points to the layer from a GeoJSON file.
map = new OpenLayers.Map('map');
var osm_layer = new OpenLayers.Layer.OSM();
map.addLayer(osm_layer);
var vector_layer = new OpenLayers.Layer.Vector('Vector Layer', {
    projection: 'EPSG:900913',
    protocol: new OpenLayers.Protocol.HTTP({
        url: 'http://yourserver/data/magyar_pontok_geojson.json',
        format: new OpenLayers.Format.GeoJSON()
    }),
    strategies: [new OpenLayers.Strategy.Fixed()]
});
map.addLayer(vector_layer);
map.addControl(new OpenLayers.Control.LayerSwitcher());
map.setCenter(new OpenLayers.LonLat(2140236.7916869, 5918060.4771277), 7);
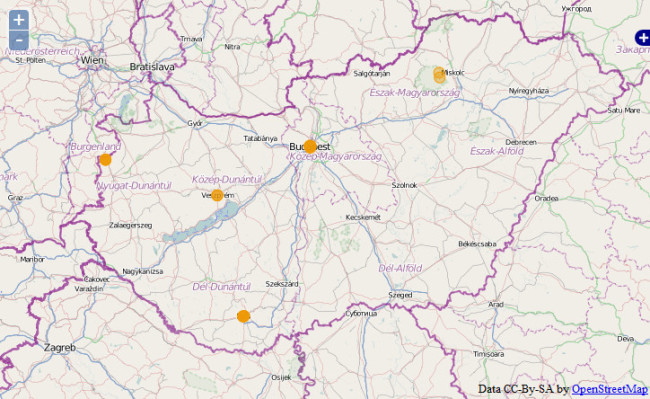 Loading points to the map
The Protocol class can be used independently from the vector layer. This comes handy when we need to preprocess manually the loaded features. In this case the format must be supplied as before, the only difference that we have to manually trigger the whole process by calling the protocol’s read() method, and we have to process data requested data in a callback function. This is shown in the following example where the data is in KML format:
map = new OpenLayers.Map('map');
var osm_layer = new OpenLayers.Layer.OSM();
map.addLayer(osm_layer);
var vector_layer = new OpenLayers.Layer.Vector('Vector Layer', {
    projection: 'EPSG:900913'
});
map.addLayer(vector_layer);
var addFeaturesToLayer = function (resp) {
    console.log(resp);
    for (var i = 0; i<resp.features.length; i++) {
        if (resp.features[i].geometry.CLASS_NAME == 'OpenLayers.Geometry.Point') {
            vector_layer.addFeatures([resp.features[i]]);
        }
    }
};
var req = new OpenLayers.Protocol.HTTP({
    url: 'http://yourserver/data/magyar_pontok.kml',
    format: new OpenLayers.Format.KML(),
    callback: addFeaturesToLayer
});
req.read();
map.addControl(new OpenLayers.Control.LayerSwitcher());
map.setCenter(new OpenLayers.LonLat(2140236.7916869, 5918060.4771277), 7);
If the data is in a special format then the OpenLayers.Request class can be used which is the lowest type of abstraction in the hierarchy, and describing its mechanism is out of the scope of this book.
If not all features are necessary to display we can use a filter. This can be achieved by assigning an OpenLayers.Filter instance to the filter option of the vector layer, or be adding a Filter strategy to the strategies array of the vector layer. The Filter strategy utilizes the OpenLayers.Filter class in a form of a strategy. During filtering several rules can be determined which decide whether a feature can be on a map or not. These rules are represented by the different subclasses of the OpenLayers.Filter class. One can filter features by comparing their attributes, there are logical operators, or spatial information may also play role in the filtering process.
The following example loads information about world cities, but only those are displayed which have Hungarian or Romanian country code ( FIPS_CNTRY attribute). The property attribute of the filter works with the attributes attribute of the feature which is filled up from the loaded file.
The excerpt of the GeoJSON file:
{
    "type": "FeatureCollection",
    "features": [
        {
            "type": "Feature",
            "properties": {
                "GMI_ADMIN": "GBR-SCT",
                "FIPS_CNTRY": "UK",
                "CNTRY_NAME": "United Kingdom",
                "POP_RANK": 5,
                "ADMIN_NAME": "Scotland",
                "STATUS": "Other",
                "PORT_ID": 32170,
                "CITY_NAME": "Dundee",
                "POP_CLASS": "100,000 to 250,000"
            },
            "geometry": {
                "type": "Point",
                "coordinates": [
                    -2.9667,
                    56.466702
                ]
            }
        },
        {
            "type": "Feature",
            "properties": {
                "GMI_ADMIN": "GBR-SCT",
                "FIPS_CNTRY": "UK",
                "CNTRY_NAME": "United Kingdom",
                "POP_RANK": 7,
                "ADMIN_NAME": "Scotland",
                "STATUS": "Other",
                "PORT_ID": 33515,
                "CITY_NAME": "Hunterston",
                "POP_CLASS": "Less than 50,000"
            },
            "geometry": {
                "type": "Point",
                "coordinates": [
                    -4.856786,
                    55.736744
                ]
            }
        }
    ]
}
The options of the vector layer:
var vector_layer = new OpenLayers.Layer.Vector('Vector Layer', {
    projection: 'EPSG:4326',
    protocol: new OpenLayers.Protocol.HTTP({
        url: 'http://yourserver/openlayers/data/world_cities.json',
        format: new OpenLayers.Format.GeoJSON()
    }),
    strategies: [
        new OpenLayers.Strategy.Fixed(),
        new OpenLayers.Strategy.Filter({
            filter: new OpenLayers.Filter.Logical({
                type: OpenLayers.Filter.Logical.OR,
                filters: [
                    new OpenLayers.Filter.Comparison({
                        type: OpenLayers.Filter.Comparison.EQUAL_TO,
                        property: 'FIPS_CNTRY',
                        value: 'HU'
                    }),
                    new OpenLayers.Filter.Comparison({
                        type: OpenLayers.Filter.Comparison.EQUAL_TO,
                        property: 'FIPS_CNTRY',
                        value: 'RO'
                    })
                ]
            })
        })
    ]
});
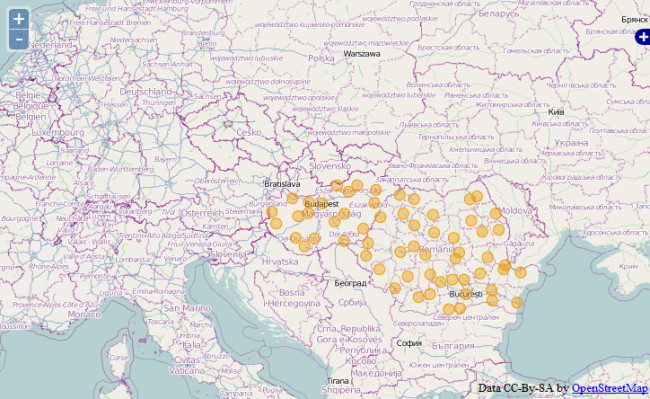 Filtering features in OpenLayers
Another common feature of the mapping APIs is the support of popups. OpenLayers handles popups differently than the Google Maps API. Here the popup is not a part of the marker, but a completely different component which has to be connected programmatically to the feature. Two new tools have to be introduced to solve this task. The OpenLayers API provides several popup subclasses through the OpenLayers.Popup class. The most sophisticated one is the OpenLayers.Popup.FramedCloud class which is the common text bubble next to the feature (marker). The other tool is the SelectFeature control which allows us to select a feature on the map. It has two important event handlers, the onSelect and the onUnselect option invoking them when a feature was selected or unselected, respectively. When a feature is selected we have to show the popup with the proper information, and we have to destroy it in the other case.
var selectControl = new OpenLayers.Control.SelectFeature(vector_layer, {
    hover: false,
    onSelect: function(feature) {
        var layer = feature.layer;
        feature.style = {
            fillColor: 'blue',
            fillOpacity: 0.7,
            strokeColor: 'darkblue',
            pointRadius: 12
        };
        layer.drawFeature(feature);

        var content = "<div>" +
            "<br/><strong>Name:</strong> <br/>" + feature.attributes.CITY_NAME +
            "<br/><strong>Location:</strong> <br/>" + feature.geometry +
            "</div>";

        var popup = new OpenLayers.Popup.FramedCloud(
            feature.id+"_popup",     //id
            feature.geometry.getBounds().getCenterLonLat(),    //lonlat
            new OpenLayers.Size(250, 100),    //content size
            content,    //content HTML
            null,     //anchor
            true, //closeBox
            function () {
                onUnselect(feature);
            }    //onClose function
        );
        feature.popup = popup;
        map.addPopup(popup);
    },
    onUnselect: onUnselect
});
var onUnselect = function(feature) {
    var layer = feature.layer;
    feature.style = null;
    feature.renderIntent = null;
    layer.drawFeature(feature);
    map.removePopup(feature.popup);
};
map.addControl(selectControl);
selectControl.activate();
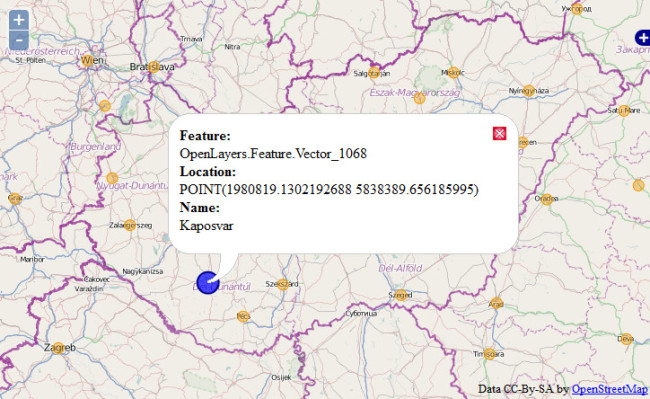 Popup window in OpenLayers
If we have a lot of features at the same place, for example when we zoom out, features may overlap on each other making the map messy. In this case it is very useful to gather the features close to each other into a cluster and show only this cluster on the map. This can be achieved by the Cluster strategy which has to option to fine tune its operation: the distance option controls the pixel distance between features that should be considered a single cluster, and the threshold is a number below which original features will be added to the layer instead of clusters. In the case of world cities the usage of clusters is evident.
var vector_layer = new OpenLayers.Layer.Vector('Vector Layer', {
    projection: 'EPSG:4326',
    protocol: new OpenLayers.Protocol.HTTP({
        url: 'http://yourserver/data/world_cities.json',
        format: new OpenLayers.Format.GeoJSON()
    }),
    strategies: [
        new OpenLayers.Strategy.Fixed(),
        new OpenLayers.Strategy.Cluster({
            distance: 15
        })
    ]
});
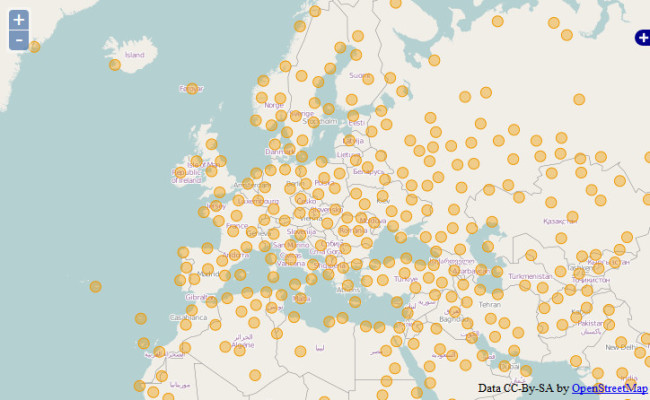 Clustering points in OpenLayers
In OpenLayers we have several choices to influence the appearance of the features. The first one is styling the features individually. When styling we assign values to certain styling attributes. These attributes mainly come from the SVG standard (see API reference). The collection of styling attributes is called symbolizer. The symbolizer can be assigned at the creation of the feature as the third parameter.
var pointGeometry = new OpenLayers.Geometry.Point(2122025.66970, 6019511.52291);
var style = {
    fillColor: "blue",
    fillOpacity: 0.4,
    strokeColor: "blue",
    strokeOpacity: 1,
    strokeWidth: 1,
    pointRadius: 25,
    label: 'ELTE'
};
var pointFeature = new OpenLayers.Feature.Vector(
    pointGeometry,
    ,
    style
);
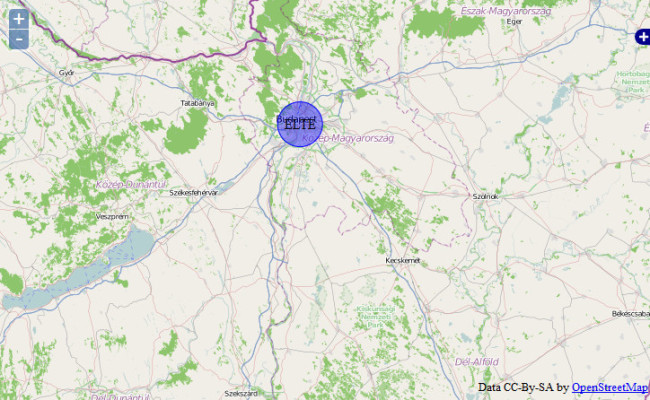 Styling individual feature in OpenLayers
Styling individually has the biggest freedom, but it is a very tedious work. In most cases all the features have the same style. With the help of the stylemaps there is the chance to define the style on the level of the vector layer, and this style applies to all features on that layer. This philosophy is very similar to cascading style sheets. The vector layer has a styleMap property which is an instance of the OpenLayers.StyleMap class. A stylemap contains several OpenLayers.Style objects according to the render intents. There are three default intents: default, select and temporary. If we only give one Style as a parameter of the StyleMap constructor then it applies to the default intent.
The OpenLayers.Style constructor has two parameters. The first one is the symbolizer, the second one is an optional object of options.
var style = new OpenLayers.Style(symbolizer, options);
The OpenLayers.Style class has a very useful feature. In the symbolizer part we can write custom variables in the form of'${attribute}'. If OpenLayers see this, first it tries to resolve the attribute name on the basis of the feature attributes object. If it fails then it goes to the context option of the style object, and tries to find the corresponding property. On success the original attribute name is replaced by its value. This is called attribute replacement, and is a very widely used feature on vector layers.
In the following example we use the former world cities file, and style it with the default rendering intent, replacing the label title with actual population rank, and defining the point radius in reverse ratio also to the population rank.
var style = OpenLayers.Util.extend(, OpenLayers.Feature.Vector.style.default);
style.label = '${POP_RANK}';
style.pointRadius = '${funcPointRadius}';
var defaultStyle = new OpenLayers.Style(
    style,
    {
        context: {
            funcPointRadius: function (feature) {
                return (8-feature.attributes.POP_RANK)*5;
            }
        }
    }
);
var vector_layer = new OpenLayers.Layer.Vector('Vector Layer', {
    projection: 'EPSG:4326',
    protocol: new OpenLayers.Protocol.HTTP({
        url: 'http://yourserver/openlayers/data/world_cities.json',
        format: new OpenLayers.Format.GeoJSON()
    }),
    strategies: [
        new OpenLayers.Strategy.Fixed()
    ],
    styleMap: new OpenLayers.StyleMap(defaultStyle)
});
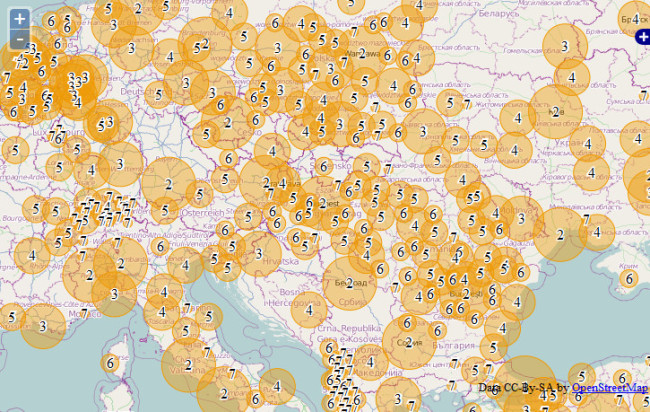 Styling features with attribute replacement
This attribute replacement is also applicable to clusters, which automatically has a count attribute defining the number of features in the cluster.
The attribute replacement has a variation in the OpenLayers API which makes these assignments easier and transparent. We can assign certain values to certain symbolizers, and tell the stylemap to use this assignment on the basis of an attribute of the feature. This is called unique value rules, and their usage can be seen in the following code:
var styles = {
    7: { pointRadius: 4, label: "${POP_RANK}" },
    6: { pointRadius: 7, label: "${POP_RANK}" },
    5: { pointRadius: 10, label: "${POP_RANK}" },
    4: { pointRadius: 13, label: "${POP_RANK}" },
    3: { pointRadius: 15, label: "${POP_RANK}" },
    2: { pointRadius: 18, label: "${POP_RANK}", fillColor: "yellow" },
    1: { pointRadius: 21, label: "${POP_RANK}", fillColor: "green" }
};
var styleMap = new OpenLayers.StyleMap();
styleMap.addUniqueValueRules('default', 'POP_RANK', styles);
var vector_layer = new OpenLayers.Layer.Vector('Vector Layer', {
    //...
    styleMap: styleMap
});
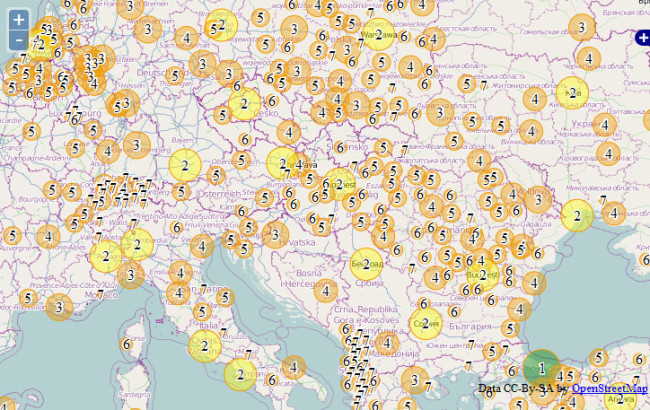 Styling with unique value rules
The most sophisticated styling is available with the help of rules. A rule is a join between a filter ( OpenLayers.Filter) and a symbolizer. If the filter matches then the rule applies to the feature. If we defined the rules we want then we add these rules to a style with its addRules() method. The flexibility of filters makes it possible to create very complicated system of rules.
The example below colorize the European countries on the basis of their population. The countries are nothing more than polygons stored in a GML file.
var aRule = new OpenLayers.Rule({
    filter: new OpenLayers.Filter.Comparison({
        type: OpenLayers.Filter.Comparison.LESS_THAN,
        property: "POP2005",
        value: 10000000
    }),
    symbolizer: {
        fillColor: "#E38C2D",
        fillOpacity: 0.5,
        strokeColor: "black"
    }
});
var bRule = new OpenLayers.Rule({
    filter: new OpenLayers.Filter.Logical({
        type: OpenLayers.Filter.Logical.AND,
        filters: [
            new OpenLayers.Filter.Comparison({
                type: OpenLayers.Filter.Comparison.GREATER_THAN,
                property: "POP2005",
                value: 10000000
            }),
            new OpenLayers.Filter.Comparison({
                type: OpenLayers.Filter.Comparison.LESS_THAN_OR_EQUAL_TO,
                property: "POP2005",
                value: 20000000
            })
        ]
    }),
    symbolizer: {
        fillColor: "#EBC137",
        fillOpacity: 0.7,
        strokeColor: "black"
    }
});
var cRule = new OpenLayers.Rule({
    filter: new OpenLayers.Filter.Comparison({
        type: OpenLayers.Filter.Comparison.GREATER_THAN,
        property: "POP2005",
        value: 20000000
    }),
    symbolizer: {
        fillColor: "#48110C",
        fillOpacity: 0.5,
        strokeColor: "black"
    }
});
var style = new OpenLayers.Style();
style.addRules([aRule, bRule, cRule]);
var vector_layer = new OpenLayers.Layer.Vector('Vector Layer', {
    projection: 'EPSG:4326',
    protocol: new OpenLayers.Protocol.HTTP({
        url: 'http://yourserver/data/europe.gml',
        format: new OpenLayers.Format.GML()
    }),
    strategies: [
        new OpenLayers.Strategy.Fixed()
    ],
    styleMap: new OpenLayers.StyleMap({
        'default': style
    })
});
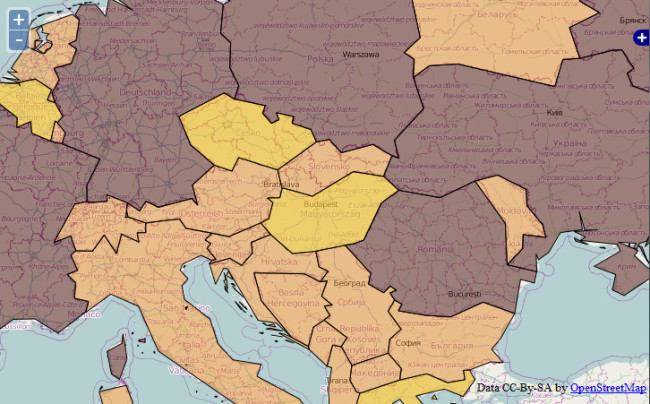 Styling with custom rules in OpenLayers
  |
 |
 |
Generated with ELTESCORM framework